This post comes from Gábor Boros, who has written an excellent tutorial that shows how to build dashboards using Plotly and QuestDB that track and chart stock prices in real-time. Thanks for the submission, Gábor!
Why Plotly and Dash are useful for real-time applications
If you're working with large amounts of data, efficiently storing raw information will be your first obstacle. The next challenge is to make sense of the data utilizing analytics. One of the fastest ways to convey the state of data is through charts and graphs.
In this tutorial, we will create a real-time streaming dashboard using QuestDB, Celery, Redis, Plotly, and Dash. It will be a fun project with excellent charts to quickly understand the state of a system with beautiful data visualizations.
Plotly defines itself as "the front end for ML and data science models", which describes it really well. Plotly has an "app framework" called Dash which we can use to create web applications quickly and efficiently. Dash abstracts away the boilerplate needed to set up a web server and several handlers for it.
Project overview
The project will be built from two main components:
- a backend that periodically fetches user-defined stock data from Finnhub, and
- a front-end that utilizes Plotly and Dash to visualize the gathered data on interactive charts
For this tutorial, you will need some experience in Python and basic SQL knowledge. We will use Celery backed by Redis as the message broker and QuestDB as storage to periodically fetch data.
Let's see the prerequisites and jump right in!
Prerequisites
- Python 3.8 or newer
- Docker & Docker Compose
- Finnhub account and sandbox API key
- Basic SQL skills
The source code for this tutorial is available at the corresponding GitHub repository.
Environment setup
Create a new project
First of all, we are going to create empty directories for our project root and the Python module:
mkdir -p streaming-dashboard/app
# streaming-dashboard
# └── app
Installing QuestDB & Redis
To install the services required for our project, we are using Docker and Docker
Compose to avoid polluting our host machine. Within the project root, let's
create a file, called docker-compose.yml. This file describes all the
necessary requirements the project will use; later on we will extend this file
with other services too.
# docker-compose.yml

version: "3"

volumes:
  questdb_data: {}

services:
  redis:
    image: "redis:latest"
    ports:
      - "6379:6379"

  questdb:
    image: "questdb/questdb:latest"
    volumes:
      - questdb_data:/root/.questdb/db
    ports:
      - "9000:9000"
      - "8812:8812"
Here we go! When you run docker-compose up, QuestDB and Redis will fire up.
After starting the services, we can access QuestDB's interactive console on
http://127.0.0.1:9000/.
Create the database table
We could create the database table later, but we will take this opportunity and create the table now since we have already started QuestDB. Connect to QuestDB's interactive console, and run the following SQL statement:
CREATE TABLE
      quotes(stock_symbol SYMBOL CAPACITY 5 CACHE INDEX, -- we are in fact just checking 3
             current_price DOUBLE,
             high_price DOUBLE,
             low_price DOUBLE,
             open_price DOUBLE,
             percent_change DOUBLE,
             tradets TIMESTAMP, -- timestamp of the trade
             ts TIMESTAMP)      -- time of insert in our table
      timestamp(ts)
PARTITION BY DAY;
After executing the command, we will see a success message in the bottom left corner, confirming that the table creation was successful and the table appears on the right-hand side's table list view.

Voilà! The table is ready for use.
Creating workers using Celery
Define Python dependencies
As mentioned, our project will have two parts. For now, let's focus on the
routine jobs that will fetch the data from Finnhub. As is the case of every
standard Python project, we are using requirements.txt to define the
dependencies the project will use. Place the requirements.txt in your project
root with the content below:
finnhub-python==2.4.14  # The official Finnhub Python client
pydantic[dotenv]==1.9.2 # We will use Pydantic to create data models
celery[redis]==5.2.7    # Celery will be the periodic task executor
psycopg[c,pool]==3.1.1  # We are using QuestDB's PostgreSQL connector
dash==2.6.1             # Dash is used for building data apps
pandas==1.4.3           # Pandas will handle the data frames from QuestDB
plotly==5.10.0          # Plotly will help us with beautiful charts
We can split the requirements into two logical groups:
- requirements for fetching the data, and
- requirements needed to visualize this data
For the sake of simplicity, we did not create two separate requirements files, though in a production environment we would do.
In order to let the application communicate with QuestDB utilizing the psycopg
client library, we need to install libpq-dev package on our system. To install
it, use your package manager; on Windows, you may need to install PostgreSQL on
your system.
Then, create a virtualenv and install the dependencies:
$ virtualenv -p python3.8 virtualenv
$ source virtualenv/bin/activate
$ pip install -r requirements.txt
Setting up the DB connection
Since the periodic tasks would need to store the fetched quotes, we need to
connect to QuestDB. Therefore, we create a new file in the app package, called
db.py. This file contains the PostgreSQL connection pool that will serve as
the base for our connections.
# app/db.py

from psycopg_pool import ConnectionPool
from app.settings import settings

pool = ConnectionPool(
    settings.database_url,
    min_size=1,
    max_size=settings.database_pool_size,
)
Define the worker settings
Before we jump right into the implementation, we must configure Celery. To
create a configuration used by both the workers and the dashboard, create a
settings.py file in the app package. We will use pydantic's BaseSettings
to define the configuration. This helps us to read the settings from a .env
file, environment variable, and prefix them if needed.
Ensuring that we do not overwrite any other environment variables, we will set
the prefix to SMD that stands for "stock market dashboard", our application.
Below you can see the settings file:
# app/settings.py

from typing import List

from pydantic import BaseSettings


class Settings(BaseSettings):
    """
    Settings of the application, used by workers and dashboard.
    """

    # Celery settings
    celery_broker: str = "redis://127.0.0.1:6379/0"

    # Database settings
    database_url: str = "postgresql://admin:quest@127.0.0.1:8812/qdb"
    database_pool_size: int = 3

    # Finnhub settings
    api_key: str = ""
    frequency: int = 5  # default stock data fetch frequency in seconds
    symbols: List[str] = list()

    # Dash/Plotly
    debug: bool = True
    graph_interval: int = 10

    class Config:
        """
        Meta configuration of the settings parser.
        """

        env_file = ".env"
        # Prefix the environment variable not to mix up with other variables
        # used by the OS or other software.
        env_prefix = "SMD_"  # SMD stands for Stock Market Dashboard


settings = Settings()
In the settings, you can notice we already defined the celery_broker and
database_url settings with unusual default values.
Some bits are missing at the moment. We still have to define the correct
settings and run the worker in a Docker container. To keep our environment
separated, we will use a .env file. One of the most significant advantages for
pydantic settings is that it can read environment variables from .env files.
Let's create a .env file in the project root, next to docker-compose.yml, so
your project structure should look like this:
├── app
│   ├── __init__.py
│   ├── db.py
│   ├── settings.py
│   └── worker.py
├── .env
├── docker-compose.yml
Add the following content to the .env file:
SMD_API_KEY = "<YOUR SANDBOX API KEY>"
SMD_FREQUENCY = 10
SMD_SYMBOLS = ["AAPL","DOCN","EBAY"]
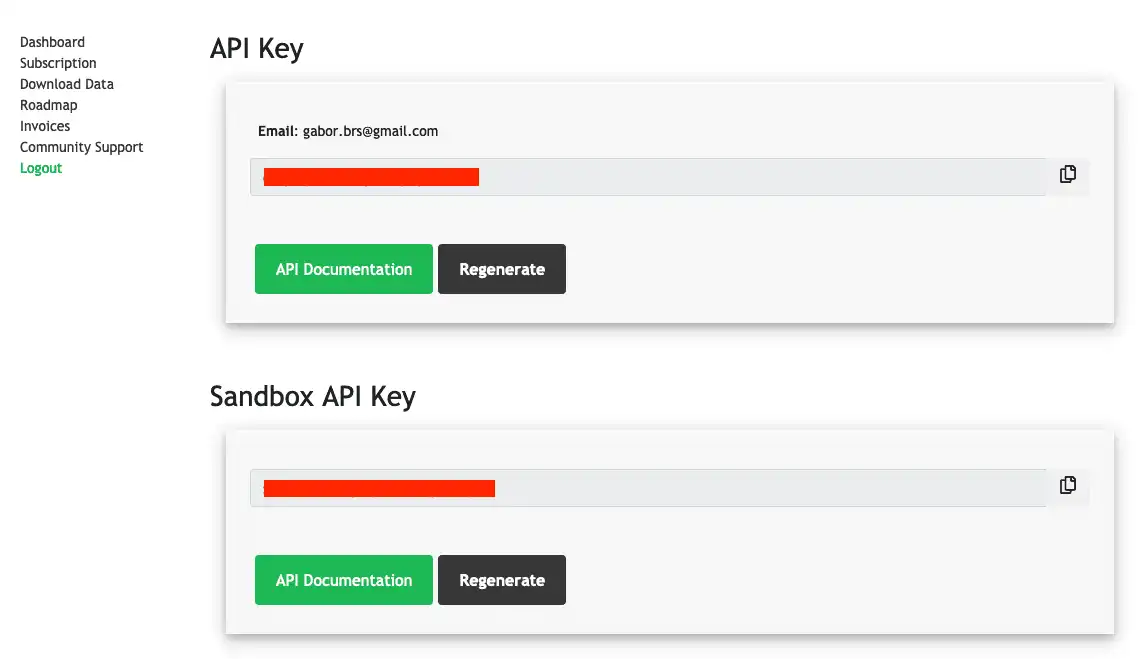
As you may assume, you will need to get your API key for the sandbox environment at this step. To retrieve the key, the only thing you have to do is sign up to Finnhub, and your API key will appear on the dashboard after login.

Create the periodic task
# app/worker.py

import finnhub
from celery import Celery
from app.db import pool
from app.settings import settings

client = finnhub.Client(api_key=settings.api_key)
celery_app = Celery(broker=settings.celery_broker)

@celery_app.on_after_configure.connect
def setup_periodic_tasks(sender, **kwargs):
    """
    Set up a periodic task for every symbol defined in the settings.
    """
    for symbol in settings.symbols:
        sender.add_periodic_task(settings.frequency, fetch.s(symbol))


@celery_app.task
def fetch(symbol: str):
    """
    Fetch the stock info for a given symbol from Finnhub and load it into QuestDB.
    """

    quote: dict = client.quote(symbol)
    # https://finnhub.io/docs/api/quote
    # quote = {'c': 148.96, 'd': -0.84, 'dp': -0.5607, 'h': 149.7, 'l': 147.8, 'o': 148.985, 'pc': 149.8, 't': 1635796803}
    # c: Current price
    # d: Change
    # dp: Percent change
    # h: High price of the day
    # l: Low price of the day
    # o: Open price of the day
    # pc: Previous close price
    # t: when it was traded
    query = f"""
    INSERT INTO quotes(stock_symbol, current_price, high_price, low_price, open_price, percent_change, tradets, ts)
    VALUES(
        '{symbol}',
        {quote["c"]},
        {quote["h"]},
        {quote["l"]},
        {quote["o"]},
        {quote["pc"]},
        {quote["t"]} * 1000000,
        systimestamp()
    );
    """

    with pool.connection() as conn:
        conn.execute(query)
Going through the code above:
import finnhub
from celery import Celery
from app.db import pool
from app.settings import settings

# [...]
In the first few lines, we import the requirements that are needed to fetch and store the data.
After importing the requirements, we configure the Finnhub client and Celery to use the Redis broker we defined in the application settings.
# [...]

client = finnhub.Client(api_key=settings.api_key)
celery_app = Celery(broker=settings.celery_broker)

# [...]
To fetch the data periodically per stock symbol, we need to programmatically create a periodic task for every symbol we defined in the settings.
# [...]

@celery_app.on_after_configure.connect
def setup_periodic_tasks(sender, **kwargs):
    """
    Set up a periodic task for every symbol defined in the settings.
    """
    for symbol in settings.symbols:
        sender.add_periodic_task(settings.frequency, fetch.s(symbol))

# [...]
The snippet above will register a new periodic per stock symbol after Celery is connected to the broker.
The last step is to define the fetch task that does the majority of the work.
# [...]

@celery_app.task
def fetch(symbol: str):
    """
    Fetch the stock info for a given symbol from Finnhub and load it into QuestDB.
    """

    quote: dict = client.quote(symbol)
    # https://finnhub.io/docs/api/quote
    # quote = {'c': 148.96, 'd': -0.84, 'dp': -0.5607, 'h': 149.7, 'l': 147.8, 'o': 148.985, 'pc': 149.8, 't': 1635796803}
    # c: Current price
    # d: Change
    # dp: Percent change
    # h: High price of the day
    # l: Low price of the day
    # o: Open price of the day
    # pc: Previous close price
    # t: when it was traded

    query = f"""
    INSERT INTO quotes(stock_symbol, current_price, high_price, low_price, open_price, percent_change, tradets, ts)
    VALUES(
        '{symbol}',
        {quote["c"]},
        {quote["h"]},
        {quote["l"]},
        {quote["o"]},
        {quote["pc"]},
        {quote["t"]} * 1000000,
        systimestamp()
    );
    """

    with pool.connection() as conn:
        conn.execute(query)
Using the Finnhub client, we get a quote for the given symbol. After the quote
is retrieved successfully, we prepare a SQL query to insert the quote into the
database. At the end of the function, as the last step, we open a connection to
QuestDB and insert the new quote.
Congratulations! The worker is ready for use; let's try it out!
Execute the command below in a new terminal window within the virtualenv, and wait some seconds to let Celery kick in:
python -m celery --app app.worker.celery_app worker --beat -l info -c 1
Soon, you will see that the tasks are scheduled, and the database is slowly filling.
Checking in on what we've built so far
Before proceeding to the visualization steps, let's have a look at what we have built so far:
- we created the project root
- a
docker-compose.ymlfile to manage related services app/settings.pythat handles our application configurationapp/db.pyconfiguring the database pool, and- last but not least,
app/worker.pythat handles the hard work, fetches, and stores the data.
At this point, we should have the following project structure:
├── app
│   ├── __init__.py
│   ├── db.py
│   ├── settings.py
│   └── worker.py
├── .env
└── docker-compose.yml
Visualizing data with Plotly and Dash
Getting static assets
This tutorial is not about writing the necessary style sheets or collecting
static assets, so you only need to copy-paste some code. As the first step,
create an assets directory next to the app package with the structure below:
├── app
│   ├── __init__.py
│   ├── db.py
│   ├── settings.py
│   └── worker.py
├── assets
│── .env
└── docker-compose.yml
The style.css will define the styling for our application. As mentioned above,
Dash will save us from boilerplate code, so the assets directory will be used
by default in conjunction with the stylesheet in it.
Download the style.css file to the assets directory, this can be done using
curl:
curl -s -Lo ./assets/style.css https://raw.githubusercontent.com/gabor-boros/questdb-stock-market-dashboard/main/assets/style.css
Setting up the application
This is the most interesting part of the tutorial. We are going to visualize the
data we collect. Create a main.py file in the app package, and let's begin
with the imports:
# app/main.py

from datetime import datetime, timedelta

import dash
import pandas
from dash import dcc, html
from dash.dependencies import Input, Output
from plotly import graph_objects

from app.db import pool
from app.settings import settings

# [...]
After having the imports in place, we are defining some helper functions and constants.
# [...]

GRAPH_INTERVAL = settings.graph_interval * 1000

TIME_DELTA = 5  # last T hours of data are looked into as per insert time

COLORS = [
    "#1e88e5",
    "#7cb342",
    "#fbc02d",
    "#ab47bc",
    "#26a69a",
    "#5d8aa8",
]


def now() -> datetime:
    return datetime.utcnow()


def get_stock_data(start: datetime, end: datetime, stock_symbol: str):
    def format_date(dt: datetime) -> str:
        return dt.isoformat(timespec="microseconds") + "Z"

    query = f"SELECT * FROM quotes WHERE ts BETWEEN '{format_date(start)}' AND '{format_date(end)}'"

    if stock_symbol:
        query += f" AND stock_symbol = '{stock_symbol}' "

    with pool.connection() as conn:
        return pandas.read_sql_query(query, conn)

# [...]
In the first few lines, we define constants for setting a graph update frequency
(GRAPH_INTERVAL) and colors that will be used for coloring the graph
(COLORS).
After that, we define two helper functions, now and get_stock_data. While
now is responsible only for getting the current time in UTC (as Finnhub
returns the date in UTC too), the get_stock_data does more. It is the core of
our front-end application, it fetches the stock data from QuestDB that workers
inserted.
Define the initial data frame and the application:
# [...]

df = get_stock_data(now() - timedelta(hours=TIME_DELTA), now(), "")

app = dash.Dash(
    __name__,
    title="Real-time stock market changes",
    assets_folder="../assets",
    meta_tags=[{"name": "viewport", "content": "width=device-width, initial-scale=1"}],
)

# [...]
As you can see above, the initial data frame (df) will contain the latest 5
hours of data we have. This is needed to pre-populate the application with some
data we have. The application definition app describes the application's
title, asset folder, and some HTML meta tags used during rendering.
Create the application layout that will be rendered as HTML. We won't write HTML, we will use Dash's helpers for that:
# [...]

app.layout = html.Div(
    [
        html.Div(
            [
                html.Div(
                    [
                        html.H4("Stock market changes", className="app__header__title"),
                        html.P(
                            "Continually query QuestDB and display live changes of the specified stocks.",
                            className="app__header__subtitle",
                        ),
                    ],
                    className="app__header__desc",
                ),
            ],
            className="app__header",
        ),
        html.Div(
            [
                html.P("Select a stock symbol"),
                dcc.Dropdown(
                    id="stock-symbol",
                    searchable=True,
                    options=[
                        {"label": symbol, "value": symbol}
                        for symbol in df["stock_symbol"].unique()
                    ],
                ),
            ],
            className="app__selector",
        ),
        html.Div(
            [
                html.Div(
                    [
                        html.Div(
                            [html.H6("Current price changes", className="graph__title")]
                        ),
                        dcc.Graph(id="stock-graph"),
                    ],
                    className="one-half column",
                ),
                html.Div(
                    [
                        html.Div(
                            [html.H6("Percent changes", className="graph__title")]
                        ),
                        dcc.Graph(id="stock-graph-percent-change"),
                    ],
                    className="one-half column",
                ),
            ],
            className="app__content",
        ),
        dcc.Interval(
            id="stock-graph-update",
            interval=int(GRAPH_INTERVAL),
            n_intervals=0,
        ),
    ],
    className="app__container",
)

# [...]
This snippet is a bit longer, though it has only one interesting part,
dcc.Interval. The interval is used to set up periodic graph refresh.
We are nearly finished with our application, but the last steps are to define two callbacks that will listen to input changes and the interval discussed above. The first callback is for generating the graph data and rendering the lines per stock symbol.
# [...]

@app.callback(
    Output("stock-graph", "figure"),
    [Input("stock-symbol", "value"), Input("stock-graph-update", "n_intervals")],
)
def generate_stock_graph(selected_symbol, _):
    data = []
    filtered_df = get_stock_data(now() - timedelta(hours=TIME_DELTA), now(), selected_symbol)
    groups = filtered_df.groupby(by="stock_symbol")

    for group, data_frame in groups:
        data_frame = data_frame.sort_values(by=["ts"])
        trace = graph_objects.Scatter(
            x=data_frame.ts.tolist(),
            y=data_frame.current_price.tolist(),
            marker=dict(color=COLORS[len(data)]),
            name=group,
        )
        data.append(trace)

    layout = graph_objects.Layout(
        xaxis={"title": "Time"},
        yaxis={"title": "Price"},
        margin={"l": 70, "b": 70, "t": 70, "r": 70},
        hovermode="closest",
        plot_bgcolor="#282a36",
        paper_bgcolor="#282a36",
        font={"color": "#aaa"},
    )

    figure = graph_objects.Figure(data=data, layout=layout)
    return figure

# [...]
The other callback is very similar to the previous one; it will be responsible for updating the percentage change representation of the stocks or a given stock.
# [...]

@app.callback(
    Output("stock-graph-percent-change", "figure"),
    [
        Input("stock-symbol", "value"),
        Input("stock-graph-update", "n_intervals"),
    ],
)
def generate_stock_graph_percentage(selected_symbol, _):
    data = []
    filtered_df = get_stock_data(now() - timedelta(hours=TIME_DELTA), now(), selected_symbol)
    groups = filtered_df.groupby(by="stock_symbol")

    for group, data_frame in groups:
        data_frame = data_frame.sort_values(by=["ts"])
        trace = graph_objects.Scatter(
            x=data_frame.ts.tolist(),
            y=data_frame.percent_change.tolist(),
            marker=dict(color=COLORS[len(data)]),
            name=group,
        )
        data.append(trace)

    layout = graph_objects.Layout(
        xaxis={"title": "Time"},
        yaxis={"title": "Percent change"},
        margin={"l": 70, "b": 70, "t": 70, "r": 70},
        hovermode="closest",
        plot_bgcolor="#282a36",
        paper_bgcolor="#282a36",
        font={"color": "#aaa"},
    )

    figure = graph_objects.Figure(data=data, layout=layout)
    return figure

# [...]
The last step is to call run_server on the app object when the script is
called from the CLI.
# [...]

if __name__ == "__main__":
    app.run_server(host="0.0.0.0", debug=settings.debug)
We are now ready to try our application with actual data. Make sure that the
Docker containers are started and execute PYTHONPATH=. python app/main.py from
the project root:
$ PYTHONPATH=. python app/main.py

Dash is running on http://0.0.0.0:8050/

 * Tip: There are `.env` or `.flaskenv` files present. Do "pip install python-dotenv"
   to use them.
 * Serving Flask app 'main' (lazy loading)
 * Environment: production
   WARNING: This is a development server. Do not use it in a production deployment.
   Use a production WSGI server instead.
 * Debug mode: off
 * Running on all addresses.
   WARNING: This is a development server. Do not use it in a production deployment.
 * Running on http://192.168.0.14:8050/ (Press CTRL+C to quit)
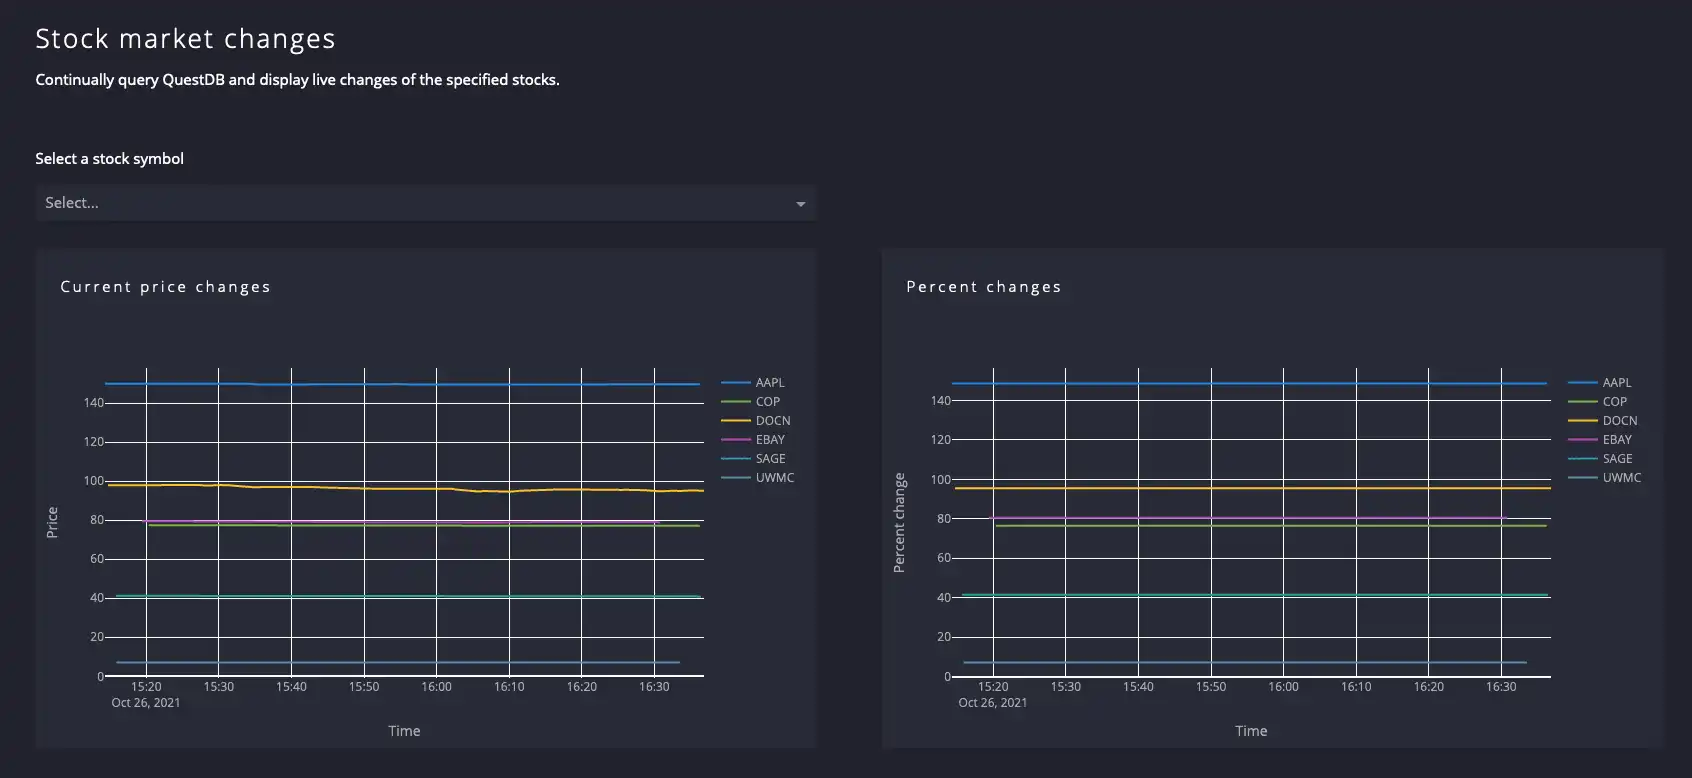
Navigate to http://127.0.0.1:8050/, to see the application in action.

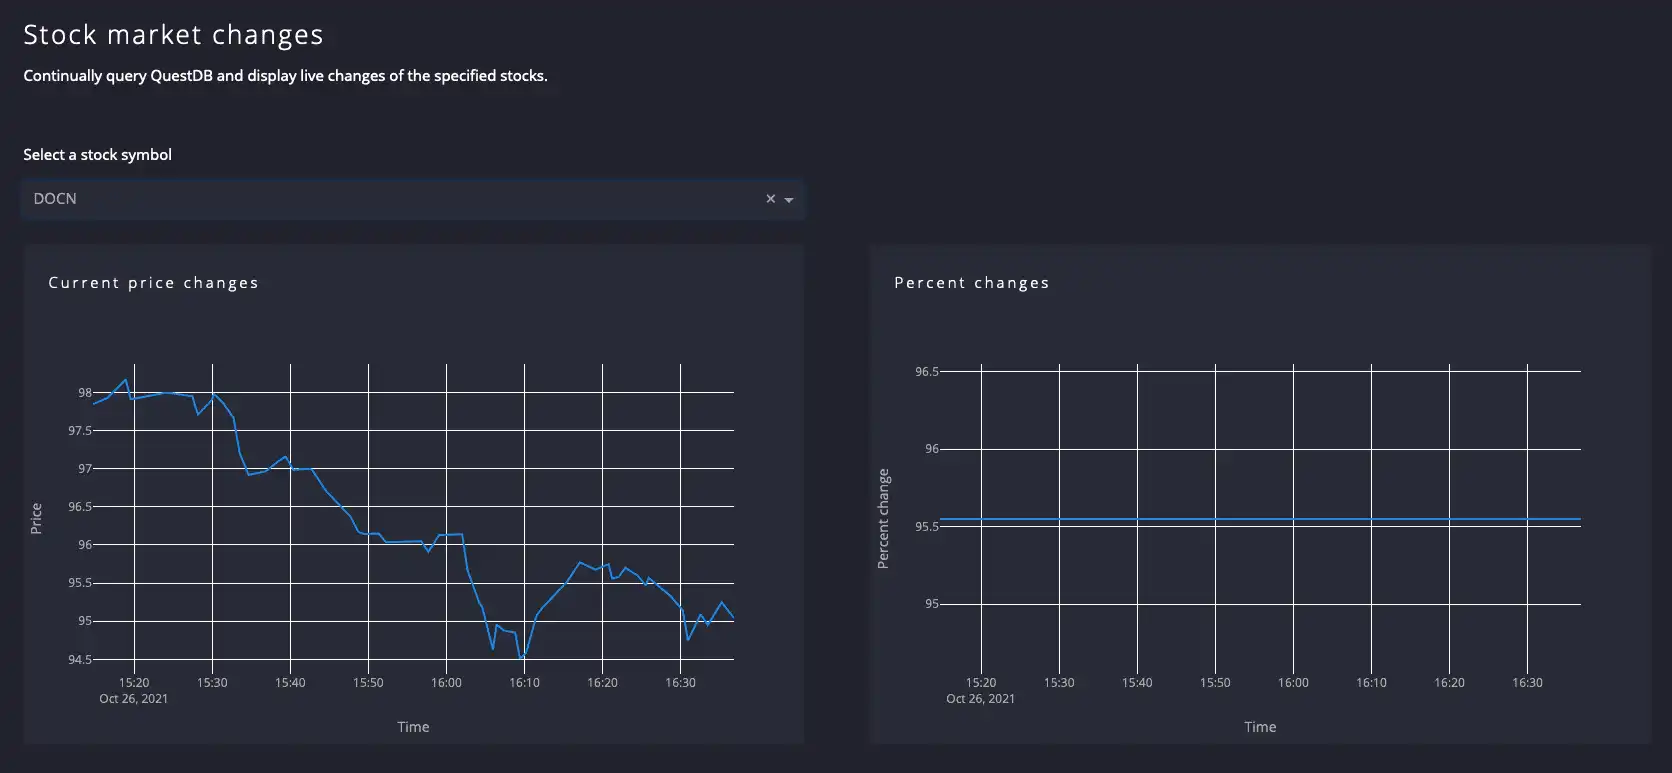
To select only one stock, in the dropdown field choose the desired stock symbol and let the application refresh.

Summary
In this tutorial, we've learned how to schedule tasks in Python, store data in QuestDB, and create beautiful dashboards using Plotly and Dash. Although we won't start trading just right now; this tutorial demonstrated well how to combine these separately powerful tools and software to create something bigger and more useful. Thank you for your attention!
If you like this content, we'd love to know your thoughts! Feel free to share your feedback or come and say hello in our community forums.